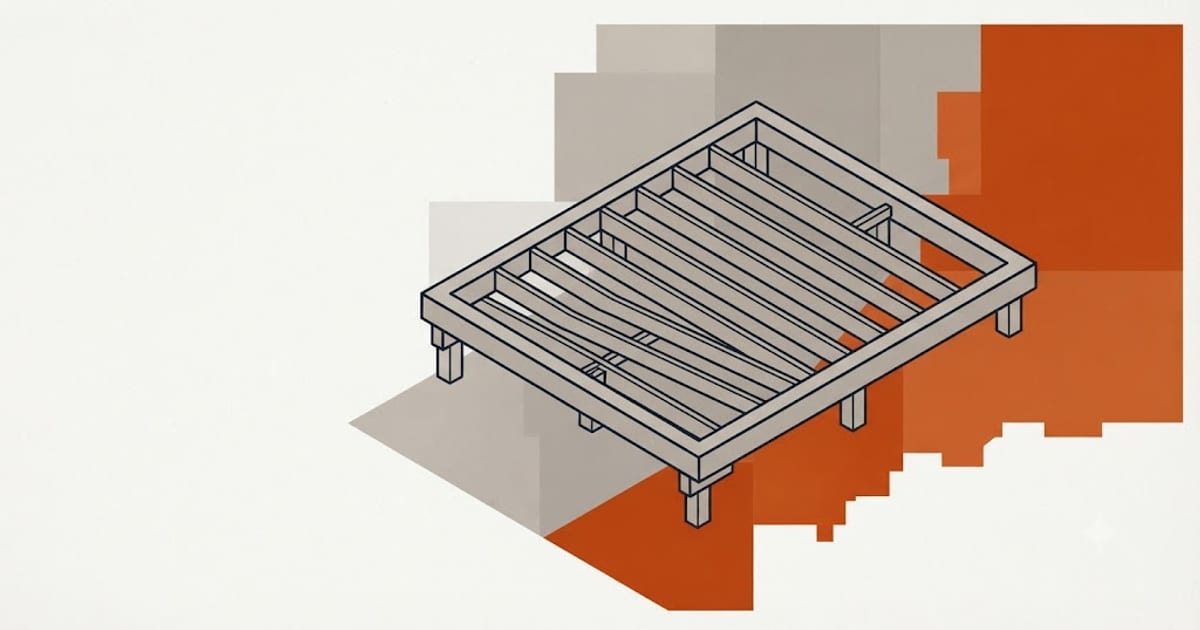
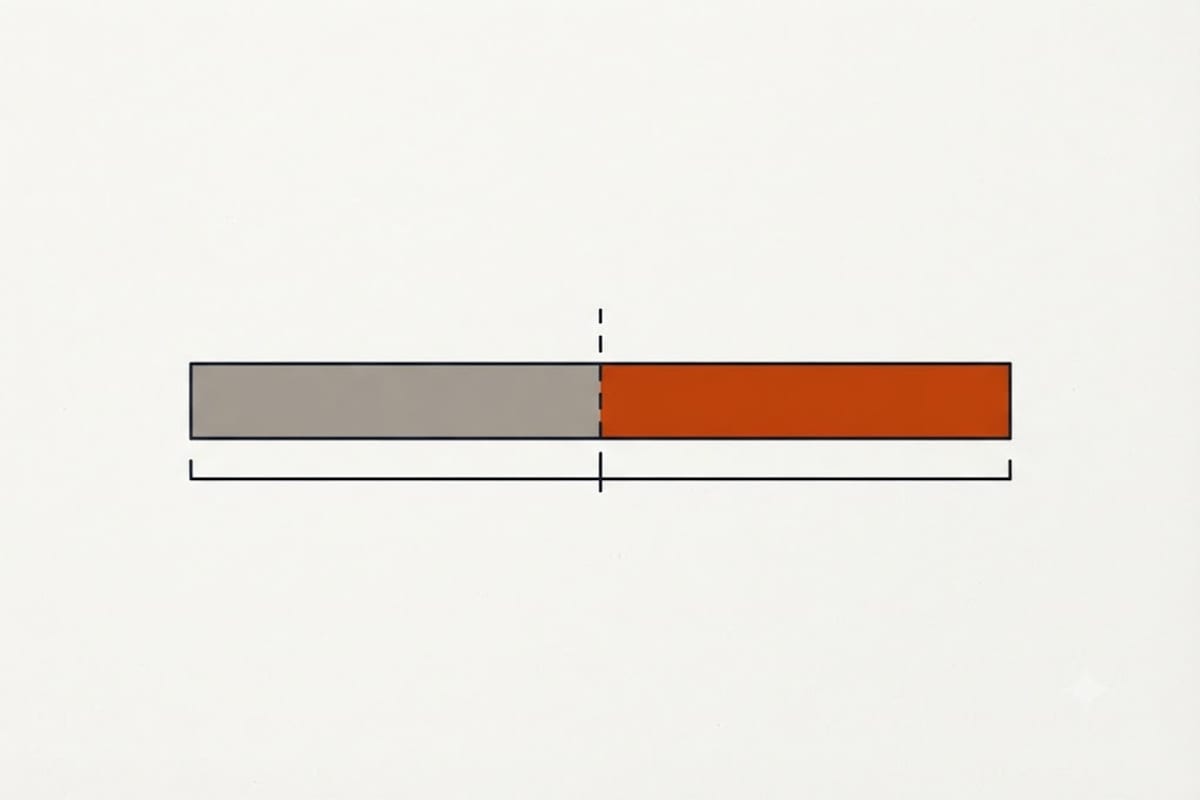
A deck is roughly 55% labor and 45% material, which puts it in the middle of the trades priced across these sites. That ratio is the whole reason state-by-state deck prices behave the way they do below.
How the numbers were built
The national price. A pressure-treated deck — footings, framing, PT decking, structural fasteners, a code-compliant railing — runs about $33 per ft² of deck in 2026, inside a market range of roughly $25 to $50.
The labor share. 55%. Lumber, hardware and concrete are the other 45%, and they are bought at national prices.
Only the labor half is scaled, by the BLS mean annual wage for carpenters in each state against the U.S. mean of $65,630 — OEWS, May 2025, SOC 47-2031. Every row is checkable.
All 51 states, a 12 × 24 ft deck
288 ft² is the most common deck built in the United States. Each state links to a page where you can set your own size.
| State | Carpenters mean pay | Labor factor | Typical total | Bid range |
|---|---|---|---|---|
| Alabama | $49,490 | 0.754 | $8,219 | $6,226 – $12,452 |
| Alaska | $80,460 | 1.226 | $10,685 | $8,095 – $16,190 |
| Arizona | $58,980 | 0.899 | $8,974 | $6,799 – $13,598 |
| Arkansas | $51,350 | 0.782 | $8,367 | $6,338 – $12,677 |
| California | $78,810 | 1.201 | $10,554 | $7,995 – $15,991 |
| Colorado | $66,190 | 1.009 | $9,549 | $7,234 – $14,468 |
| Connecticut | $68,680 | 1.046 | $9,747 | $7,384 – $14,768 |
| Delaware | $62,690 | 0.955 | $9,270 | $7,023 – $14,045 |
| District of Columbia | $65,990 | 1.005 | $9,533 | $7,222 – $14,443 |
| Florida | $52,560 | 0.801 | $8,463 | $6,411 – $12,823 |
| Georgia | $50,290 | 0.766 | $8,282 | $6,274 – $12,549 |
| Hawaii | $87,480 | 1.333 | $11,244 | $8,518 – $17,037 |
| Idaho | $56,080 | 0.854 | $8,743 | $6,624 – $13,248 |
| Illinois | $80,320 | 1.224 | $10,674 | $8,086 – $16,173 |
| Indiana | $64,950 | 0.99 | $9,450 | $7,159 – $14,318 |
| Iowa | $57,640 | 0.878 | $8,868 | $6,718 – $13,436 |
| Kansas | $59,460 | 0.906 | $9,013 | $6,828 – $13,655 |
| Kentucky | $54,820 | 0.835 | $8,643 | $6,548 – $13,095 |
| Louisiana | $51,600 | 0.786 | $8,387 | $6,353 – $12,707 |
| Maine | $63,300 | 0.964 | $9,318 | $7,059 – $14,119 |
| Maryland | $69,040 | 1.052 | $9,776 | $7,406 – $14,812 |
| Massachusetts | $79,680 | 1.214 | $10,623 | $8,048 – $16,096 |
| Michigan | $62,140 | 0.947 | $9,226 | $6,989 – $13,979 |
| Minnesota | $70,320 | 1.071 | $9,878 | $7,483 – $14,966 |
| Mississippi | $49,280 | 0.751 | $8,202 | $6,213 – $12,427 |
| Missouri | $65,000 | 0.99 | $9,454 | $7,162 – $14,324 |
| Montana | $59,640 | 0.909 | $9,027 | $6,839 – $13,677 |
| Nebraska | $54,960 | 0.837 | $8,654 | $6,556 – $13,112 |
| Nevada | $69,250 | 1.055 | $9,792 | $7,418 – $14,837 |
| New Hampshire | $64,100 | 0.977 | $9,382 | $7,108 – $14,215 |
| New Jersey | $71,990 | 1.097 | $10,011 | $7,584 – $15,168 |
| New Mexico | $57,430 | 0.875 | $8,851 | $6,705 – $13,410 |
| New York | $75,970 | 1.158 | $10,328 | $7,824 – $15,648 |
| North Carolina | $50,510 | 0.77 | $8,300 | $6,288 – $12,575 |
| North Dakota | $57,980 | 0.883 | $8,895 | $6,738 – $13,477 |
| Ohio | $62,590 | 0.954 | $9,262 | $7,017 – $14,033 |
| Oklahoma | $49,610 | 0.756 | $8,228 | $6,233 – $12,467 |
| Oregon | $70,880 | 1.08 | $9,922 | $7,517 – $15,034 |
| Pennsylvania | $63,220 | 0.963 | $9,312 | $7,055 – $14,109 |
| Rhode Island | $64,320 | 0.98 | $9,400 | $7,121 – $14,242 |
| South Carolina | $55,350 | 0.843 | $8,685 | $6,580 – $13,159 |
| South Dakota | $51,330 | 0.782 | $8,365 | $6,337 – $12,674 |
| Tennessee | $53,990 | 0.823 | $8,577 | $6,498 – $12,995 |
| Texas | $50,990 | 0.777 | $8,338 | $6,317 – $12,633 |
| Utah | $55,360 | 0.844 | $8,686 | $6,580 – $13,161 |
| Vermont | $62,000 | 0.945 | $9,215 | $6,981 – $13,962 |
| Virginia | $55,390 | 0.844 | $8,688 | $6,582 – $13,164 |
| Washington | $79,170 | 1.206 | $10,582 | $8,017 – $16,034 |
| West Virginia | $50,540 | 0.77 | $8,302 | $6,289 – $12,579 |
| Wisconsin | $65,300 | 0.995 | $9,478 | $7,180 – $14,360 |
| Wyoming | $59,350 | 0.904 | $9,004 | $6,821 – $13,642 |
What the table shows
1.37× top to bottom. Hawaii at $11,244 against Mississippi at $8,202 — a $3,042 gap on a $9,504 national job. Carpenter pay itself ranges about 45% across the country, but because it only touches 55% of the bill, the total compresses to under 40%.
The practical reading: your state is worth about $1,500 either way on a deck this size. The difference between the cheapest and dearest bid you will personally receive in your own town is usually larger than that. Geography is a sanity check, not a budget.
Note who is at the top after Hawaii and Alaska — Illinois, Massachusetts and Washington. Carpentry is unionized and seasonal in those markets, and a short outdoor building season is priced into the wage.
The three lines that move a deck more than any state line does
Height off the ground. A deck 3 feet up and a deck 10 feet up have the same square footage and completely different framing. Taller means bigger posts, more bracing, a guard rail that is no longer optional, and stairs that turn into a project of their own. See deck post size by height.
Stairs. Two steps down to grade is nothing. A full flight is stringers, treads, a landing, and a railing on both sides — routinely 15–20% of the whole job on a deck this size, and it is not in the number above. See deck stair stringer layout.
Attachment. A freestanding deck sits on its own posts. A ledger-attached deck cuts into the house, and that means flashing, fastener schedules and an inspection. Ledger failure is the leading cause of deck collapse, so this is the one line where the cheap answer is genuinely the wrong one. See ledger board attachment code.
Permits and frost depth are regional, and the wage table cannot see them
Two genuinely geographic costs sit outside this model.
Frost depth. A footing has to reach below the frost line. In Florida that is a shallow pad; in Minnesota it is four feet of hole per footing, which is a different job with a different machine. See frost depth by state.
Permits. Attached decks need one nearly everywhere, and the fee plus the inspection schedule varies by municipality rather than by state. See deck permit cost and when you need one.
Where composite changes the arithmetic
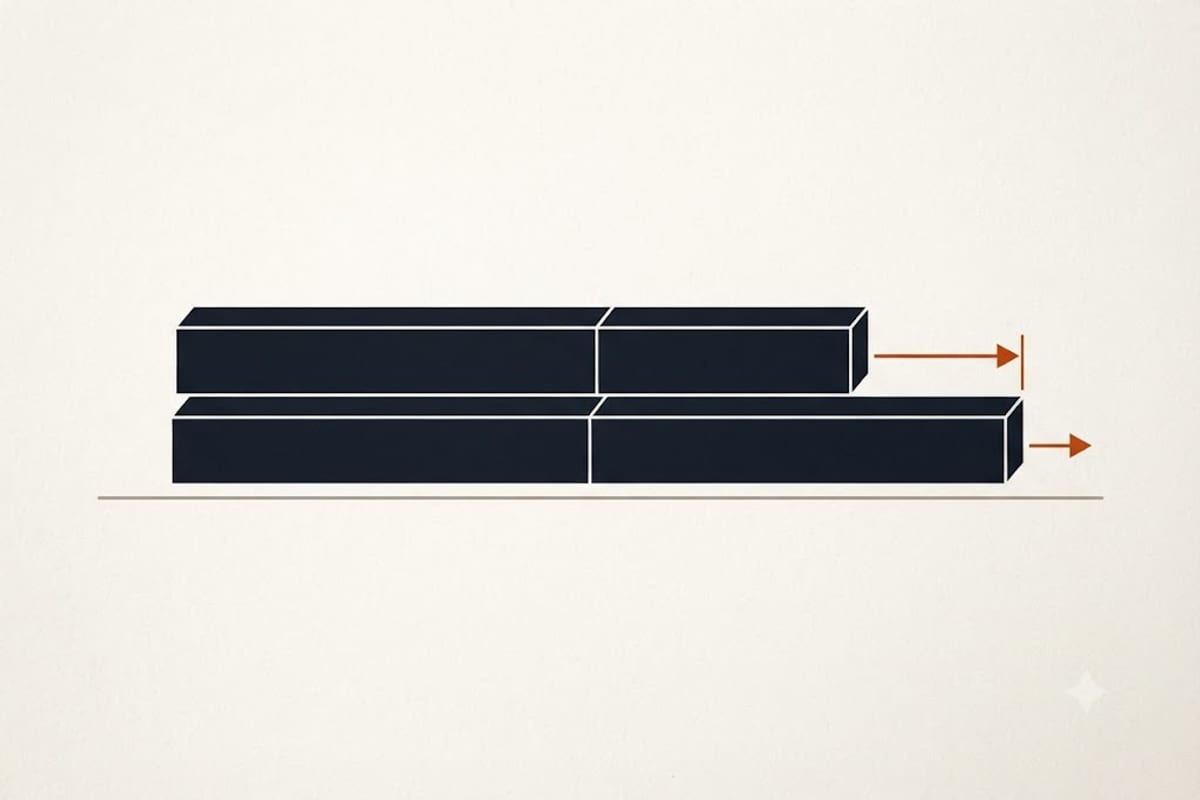
Swapping pressure-treated boards for composite raises the material half and leaves the labor half almost untouched — footings, framing and hours barely move, because only the walking surface changes.
That is why the percentage increase on a total is always smaller than the board price difference suggests, and it is also why composite looks better on a large simple deck than on a small complicated one. See composite vs pressure treated cost.
How to use this
Open your state above, set your real deck size, then add stairs and height separately. Compare the bid range to your quotes: below it usually means a freestanding deck priced against an attached one, or a railing left out.